Unified Modeling Language
A modeling language for a domain provides categories and rules for the structural and behavioral representations of systems in the domain. The Unified Modeling Language (UML) is an object modeling language whose primary domain is the design of software-based systems. UML is a rich and complex modeling language, but its use in this course is be extremely circumscribed. This lecture provides a minimalist introduction to UML, focused on the concerns of this course.
This course uses UML primarily as an aid to conceptual modeling and not as a direct guide to software implementation. UML provides a collection of diagrammatic conventions that prove convenient for the representation of conceptual models. For example, this course uses UML class diagrams to illustrate the agents in a conceptual model, whether or not the implementation language provides classes. Used in this way, UML formalisms are useful to agent-based modelers, regardless of the programming paradigm used for implementation.
The diagrammatic structure of UML is particularly suited for the communication of core model structures to non-programmers. This course uses simplified UML class diagrams and UML activity diagrams to the document conceptual models and, to a lesser extent, to guide program designs. Good documentation helps to communicate the model’s purpose and capabilities to users. The process of documenting the conceptual model also serves to enhance the understanding of the modeler, to suggest useful abstractions, and to guide implementation decisions.
Structure and Behavior
UML has two primary classifications of diagrams:
Behavior diagrams represent behaviors of the software (e.g., the kinds of actions or the sequences in which actions occur).
Structure diagrams represent software architecture (classes, objects, dependencies, inter-relationships, etc.).
Within this broad classification, will care most about two specific types of diagrams: class diagrams, and activity diagrams. However, we first briefly touch upon use-case diagrams.
Use-Case Diagrams
Use-case diagrams link actors to use cases. A use case characterizes how user behaviors interact with a system to produce outcomes that affect the actors. So it is a behavior diagram. The users of the system are called actors, but they need not be human.
Use case diagrams are often used to quickly sketch the functional requirements of a software system. Understanding how a system will be used can be an important aid to the development of a useful system. It can also be an important aid to understanding of an existing system.
Use-Case Notation
Each actor role has a stick-person representation. An actor represents a role for interacting with the system. A use case is represented by an ellipse. It is a task to be performed by interacting with the system; the task yields a result that is detectable by affected actors.
A solid line associates an actor to a use case. If the actor initiates the use case, it may have an arrowhead at the use-case end of the line. This arrow originates with the primary actor, who invokes the uses case. The arrowhead is optional.
A simple use case diagram is like an unordered list of tasks associated with each actor. The diagram should generally be accompanied by a nontechnical explanation of each use case. A task may include subtasks, which can be indicated by dashed arrows. (A subtask must be completed as part of completing the task.)

Use-Case Diagram: Interaction with a Simulation Model
Use-Case Diagrams for Agents
A possible interesting application of use-case diagrams in agent-based modeling arises when we model agents as interacting with a system. For example, in a banking model, a customer agent may interact with a bank agent. We may have two actor roles (customer and bank) participating in a system that allow deposits and withdrawals.
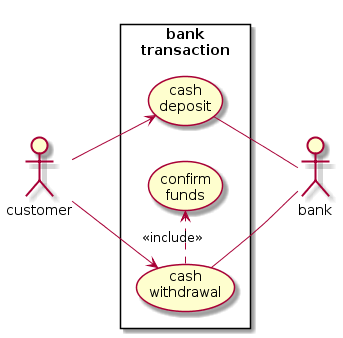
Use-Case Diagram: Banking Transactions
Class Diagram
From Use Cases to Classes
Once we have a good understanding of the tasks our system needs to perform, be can begin allocating responsbilities for those tasks. Use case diagrams can be helpful in the first stage. Class diagrams can be helpful in the second stage. Class diagrams specify the data attributes and behaviors of the actors inside our software system. Thinking of the banking diagram above, we see that the implications for an agent-based modeler are more extensive than for those who design a real-world banking system. Specifically, an agent-based model will include objects that play the role of customer and bank.
UML Class Box
A class diagram uses class boxes to depict types in a model. A class is a general type of object, not a specific instance of that type. It offers a way to classify a set of objects in a model, such as types of agents. For example, a Student class will describe the features of any student, not a particular student.
A class box presents key features of a single type of objects: its attributes and behaviors. Attributes are sometimes called data attributes or member variables. Operations are sometimes called method attributes or member functions. and relationships with other classes. A class box is a rectangle that is typically subdivided into three stacked compartments. The top compartment holds the name of the class (i.e., the type of object). The middle compartment holds a list of attributes. The bottom compartment holds a list of behaviors.
+-------------+
|  ClassName  |
+-------------+
|attribute1   |
|attribute2   |
+-------------+
|behavior1()  |
|behavior2()  |
+-------------+
Note that behaviors have are parentheses, which will delimit any parameters owned by the behavior. In this course, this does not imply that the implementation language uses parentheses to define or to invoke procedures. It is simply a diagrammatic convention when describing the behaviors in a conceptual model.
It is not usually necessary to list all attributes and behaviors.
List only those attributes that help with out particular documentation task.
One may even omit all the attributes if that suits a particular purpose.
Often we add information about the type of each attribute
and the return type of each behavior (if any).
To make this concrete, consider the following Student class.
Note how we separate the attribute and its type by a colon.
+-------------------------+
|         Student         |
+-------------------------+
|id : Integer             |
|prof : Professor         |
+-------------------------+
|get_gpa() : Real         |
+-------------------------+
A UML class diagram also depicts relationships between classes, called class associations. A line between two classes denotes an association relationship, and decorations on the lines can indicate the type of relationship. In the next example, each Student instance has a reference to at least one Professor instance. We can also put an arrow next to the component to indicate the direction the relationship can be “navigated”. Default communication is bidirectional, so in this case a Student knows about its Professor and vice versa.
+---------+ 1..*     1..* +-----------+
| Student |---------------| Professor |
+---------+               +-----------+
Sometimes, an annotation above the arrow indicates how many of this type of component are contained by the aggregate.
This multiplicity annotation provides specifies an inclusive range with the endpoints
separated by two dots.
For example, 1..5 is an integer range from \(1\) to \(5\), inclusive.
An asterisk means that there is no upper bound.
For example, 1..* is an unbounded integer range with a minimum of \(1\).
In this case, a student can be associated with one or more professors,
and a professor can be associated with one or more students.
A “whole-part” or “aggregate-component” relationship is called aggregation. It is indicated by a line with an open diamond beside the aggregate. For example, a class comprises one or more students.
+---------+        1..* +-----------+
| Class   |<>-----------| Student   |
+---------+             +-----------+
If the lifetime of an Student were determined by the lifetime of a Class, this would be a stronger form of aggregation that is called “composition”. (I recommend not joining that class.) We can indicate this by filling in the diamond.
+---------+        1..* +-----------+
| Class   |<#>----------| Student   |
+---------+             +-----------+
The inheritance relationship in UML is also drawn as a line, with a hollow triangular arrowhead pointing to the base class. Since the base class generalizes its subclasses, UML calls this relationship “generalization”. If we want to show that multiple subclasses inherit from the same base class, we often join the generalization arrows to form a tree structure.
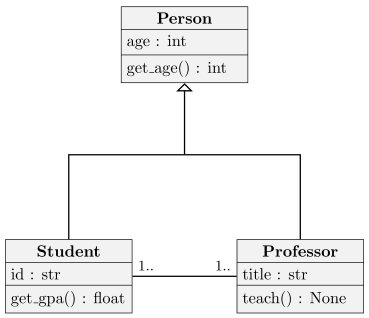
Simple Class Diagram with Generalization and Association
There are tools for some object-oriented programming languages that can translate detailed class diagrams into implementations in code. In that case, diagrams can become formal representations of the actual code that implements an agent. In contrast, this course uses such diagrams simply to guide model conceptualization. A given diagram can be given many different implementations in code, and the implementation need not be object-oriented.
UML Activity Diagrams
Activity diagrams are behavior diagrams that represent the sequence (and conditions) of actions (which can convert inputs into outputs).
We are particularly interested in representing control sequencing and data flow.
Activity Diagram: Core Symbols
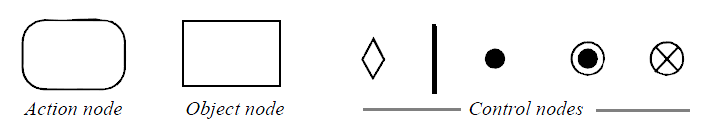
A simple activity diagram is a collection of nodes with directed connections called activity edges. There are three basic node types: action node, object node, and control node. An activity is decomposed into a collection of actions.
Activity Diagram Nodes
- Action node:
A rectangle with rounded corners; labeled with the action name (e.g., the name given to behavior). An action name is typically a verb. Only one arrow should leave each action (but see the discussion of fork nodes).
- Object node:
A rectangle with squared corners. Indicates object flow, where an object is a classifier instance. (We will not make much use of object nodes.)
- Control nodes:
Specific symbols to represent control flow (including the initial node and the final node).
An activity begins at an initial node and obeys the control flow until reaching a terminal node.
Control Nodes
Among the control nodes we particularly care about the inital node (filled circle), the activity final node (nested filled circle), and decision/merge nodes (diamond).
The initial node and activity final node two can be labeled by adding text above them. UML specifies using an adjacent note rather than directly labeling decision nodes, but nevertheless, when convenient, we will label our decision nodes (usually with a question if the decision is binary, in line with older flow-diagram practices).
The label indicates the decision condition determining the control flow. We link our nodes with arrows indicating control flow. Control flow arrows leaving a decision node are usually labeled to indicate the conditions under which each will be taken.
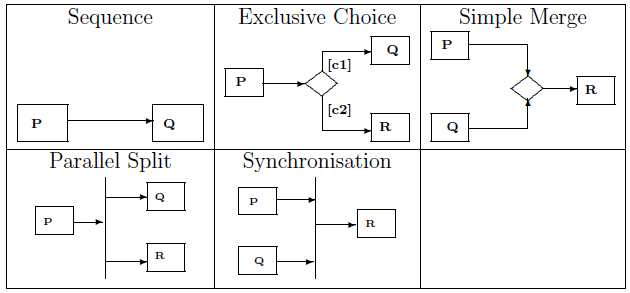
Basic Control Flow in Activity Diagrams
Example
Examples make these concepts concrete. Consider an activity diagram of a fairly general iterative process.
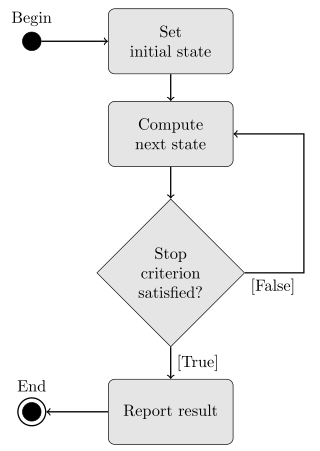
Activity Diagram of an Iterative Process
Activity Partitions (Swimlanes)
Sometimes we want to show not just the activity but also the responsible agent. To achieve this, use an `activity partition`__. This partitions the activity diagram’s depiction of activity flow in order to indicate the responsible agents. The following diagram for a ticket vending machine uses vertical swimlanes to illustrate this concept.
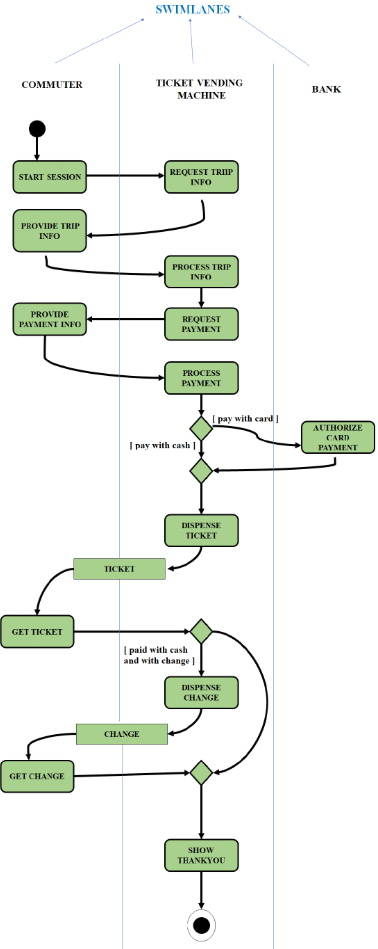
Swimlanes
Sequence Diagrams
Sometimes it is helpful to lay out the actions a program will take sequentially, showing how messages are passed between objects over time. Use a sequence diagram in this instance.
Across the top of the diagram, place rectangles representing the interacting objects. Each rectangle is the head of a lifeline for the object (see below). More subordinate objects lie further to the right. Interaction with the system is usually initiated by an actor that is outside of the system. The actor is sometimes represented as a stick figure and lies furthest to the left. Other objects are given a name and a type.
Lifelines
Below each object is a vertical line, called its lifeline. Lifelines are thick while an object is active but thin while it is inactive. Time is increasing as we descend the lifeline towards its end.
Messages
Message sending is represented as an arrow from the lifeline of the message-sending object to the lifeline of its recipient.
For more details see: https://www.geeksforgeeks.org/unified-modeling-language-uml-sequence-diagrams/
Summary and Conclusions
Further Reading
There are many excellent books on UML. A good introductory treatement is [Fowler-2018-AW]. The `formal specification`__ is freely available. The formal specification is lengthy and somewhat intimidating; the `distillations by Kirill Fakhroutdinov`__ are often entirely adequate and much more accessible. [Bersini-2012-JASSS] provides an introduction to the use of UML for ABMs. [Bauer.Muller.Odell-2001_Ciancarini.Wooldridge]_ propose extending UML to better accommodate the representation of interaction protocols in ABMS.
Resources
There are many point-and-click programs for producing UML diagrams. An interesting alternative for simple diagrams is PlantUML, which converts a text-based representation into a UML diagram. For example, a class diagram where class B extends class A may be produced as follows.
@startuml
skinparam shadowing false
hide circle
class A {
attr01
op01()
}
class B extends A {
attr02
op02()
}
@enduml
This example includes two style options, which may be omitted based on personal preferences. Experiment with this example on the plantuml server`__.
Additional Resources
Ed Seidewitz was co-chair of OMG fUML when he videotaped a useful `UML Overview`__. Lucidchart provides free UML tutorials as a way to advertise their diagramming software. Their `UML Class Diagram Tutorial`__ provides a gentle introduction to class diagrams.
References
Bersini, Hugues. (2012) UML for ABM. Journal of Artificial Societies and Social Simulation 15, Article 9. http://jasss.soc.surrey.ac.uk/15/1/9.html
Fowler, Martin. (2018) UML Distilled: A Brief Guide to the Standard Object Modeling Language. : Addison-Wesley.
Copyright © 2016–2023 Alan G. Isaac. All rights reserved.
- version:
2023-07-15